SHMI
WIP - not suitable for productive use.
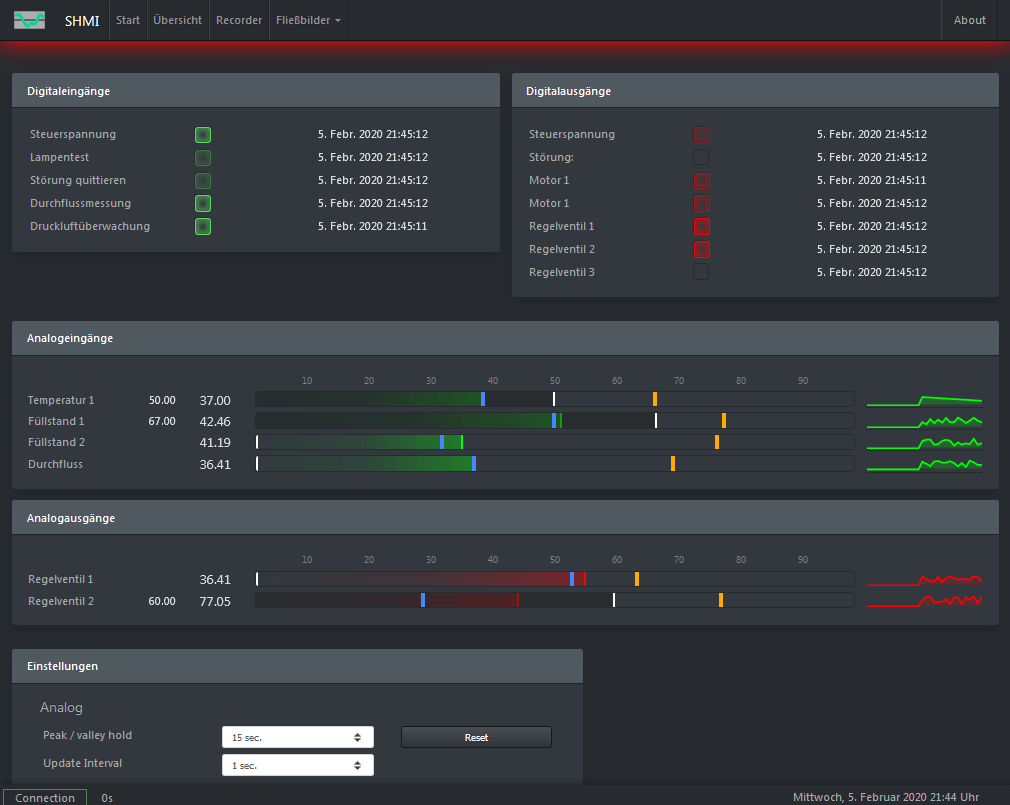
Overview
A small, web-based (HTML, JavaScript and SVG) visualization for PLC or other small devices
With minimal effort, values from a controller (or another program) can be visualized. No HTML, CSS or JavaScript knowledge is required.
In the simplest version only about 700 KB in size!
As CDN version only about 150 KB!
It is currently a pure display of values. A control of data is not yet possible.
Features
- Only a browser is required for the display
- Responsive design
- For the basic configuration, only a JSON file, as a data interface, must be generated by the controller
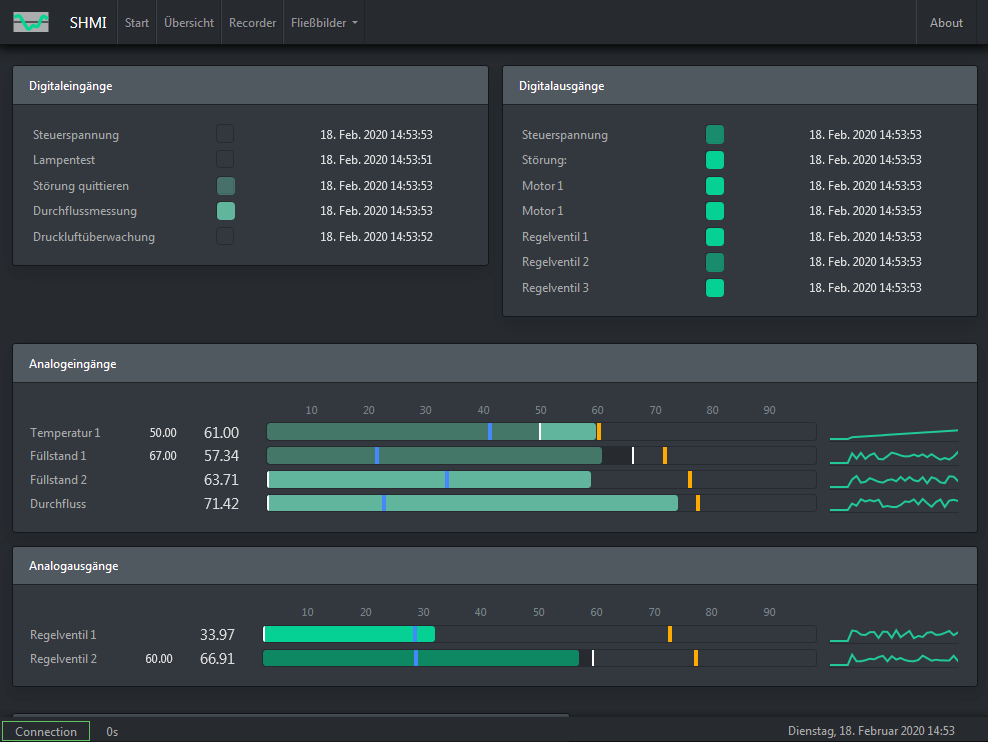
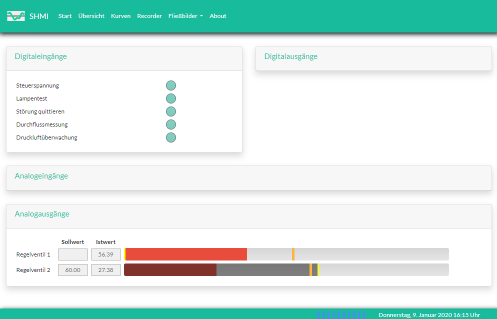
- The display of all values on the start page is automatically generated based on the data interface
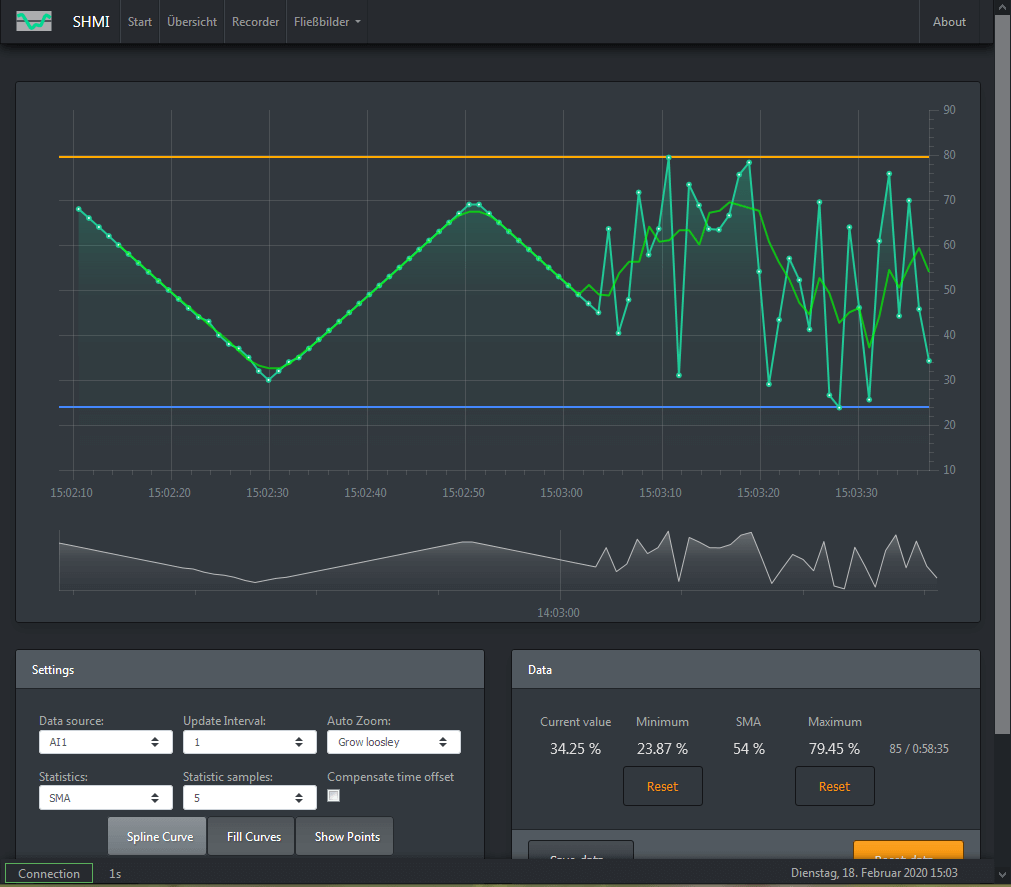
- Values can be displayed in curves, recorded and saved as CSV file
 )
) - Flow charts can be equipped with display elements (widgets) by drag and drop:
- The elements in an SVG image can be animated directly, e.g:
- Design easy to change via bootstrap theme (default design: Slate):
 or by your own style sheets.
___
or by your own style sheets.
___
Requirements
A Web server must be present on the automation device.
A local installation is also possible.
Browser
Tested with:
- FireFox (> V71.0 64bit, Windows 7)
- Edge ( >V79.0, Windows 10)
Browser settings for local data source
… if no web server is installed.
- FireFox: about:config
security.fileuri.strict_origin_policy = false - Edge, chrome, etc.: Start Parameters
--allow-file-access-from-from-files
Installation
Copy the contents of the SHMI directory to the web server and configure it appropriately.
Or install it locally ( see also Prerequisites )
Configuration of SHMI
Data points
DI/DO may take the following values.
- 0: off
- 1: on
- 2: Warning (orange)
- 4: Error (red)
- 8: Info + 0/1 (in SVG additional blue filling) - e.g. for manual operation
- LIVE-BIT (Format: 1/0)
- Must toggle with each new record: Display in the status bar
- TIMESTAMP (format: UNIX timestamp in seconds)
- Time stamp from device or application : Here the difference to the system time is calculated and displayed in the status bar.
- WARN (not yet in use)
- number of the warning message - or text
- ALARM (not yet in use)
- number of the alarm message - or text
- MESSAGE (not yet in use)
- number of the message - or string
- DIn (Format: Integer 0-9)
- digital input
- DOn (Format: Integer 0-9)
- digital output
- AIn (format: float or integer)
- Analog input in %
- AOn (format: float or integer)
- Analog output in %
- AIn_SP (Format: Float or Integer)
- Analog input setpoint in %
- AOn_SP (format: float or integer)
- Analog output setpoint in %
Interface
A corresponding file must be generated by the controller:
data/data.json
in which the values are entered.
The structure of the file is self-explanatory.
As an example:
{
"LIVE-BIT":0,
"TIMESTAMP":1580716216,
"WARN":-1,
"ALARM":-1,
"MESSAGE":-1,
"DI0":1,
"DI1":1,
"DI2":0,
"DI4":0,
"DI7":1,
"DO0":0,
"DO1":0,
"DO2":1,
"DO8":1,
"DO9":0,
"DO10":1,
"DO14":1,
"AI0":14,
"AI1":97.07,
"AI2":44.96,
"AI3":87.43,
"AI0_SP":50,
"AI1_SP":67,
"AO0":4.77,
"AO1":8.85,
"AO1_SP":60
}
The first time the page is called up, this file is read out and the page is built up. Then only the values from the file are queried.
Interface Siemens S7-1500
Example interface for the output of CPU variables:
{
"DI0":":="webdata".DI[0]:"
"DI1":":="webdata".DI[1]:"
"DI2":":="webdata".DI[2]:"
"DI4":":="webdata".DI[4]:"
"DI7":":="webdata".DI[7]:"
"DO0":":="webdata".DO[0]:"
"DO1":":="webdata".DO[1]:"
"DO2":":="webdata".DO[2]:"
"DO9":":="webdata".DO[8]:"
"DO10":":="webdata".DO[9]:"
"DO10":":="webdata".DO[10]:"
"DO14":":="webdata".DO[14]:"
"AI0":":="webdata".AI[0]:"
"AI1":":="webdata".AI[1]:"
"AI2":":="webdata".AI[2]:"
"AI3":":="webdata".AI[3]:"
"AO0":":="webdata".AO[0]:"
"AO1":":="webdata".AO[1]:"
}
The values are located in a correspondingly structured data block “webdata”.
See also Siemens: Creating and using own web pages for S7-1200 / S7-1500.
Labeling of the data points
The texts for labeling the data points are in the file:
lng/en_dp.json
and are also read in the first time the page is called up.
Example:
{
"DI0": "Control voltage",
"DI1": "Lamp test",
"DI2": "Acknowledge fault",
"DI4": "Flow measurement",
"DI7": "Compressed air monitoring",
"DO0": "Control voltage",
"DO1": "Fault:",
"DO2": "Engine 1",
"DO8": "Engine 1",
"DO9": "Control valve 1",
"DO10": "Control valve 2",
"DO14": "Control valve 3",
"AI0": "Temperature 1",
"AI1": "Level 1",
"AI2": "Level 2",
"AI3": "Flow rate",
"AO0": "Control valve 1",
"AO1": "Control valve 2",
"AO2": "Control valve 3"
}
Recorder
Since everything is recorded in the browser, no other tabs may be open in the browser during recording. Also the browser window must not be minimized. In both cases there will be dropouts in the measured values. This can be compensated by a correspondingly high update interval.
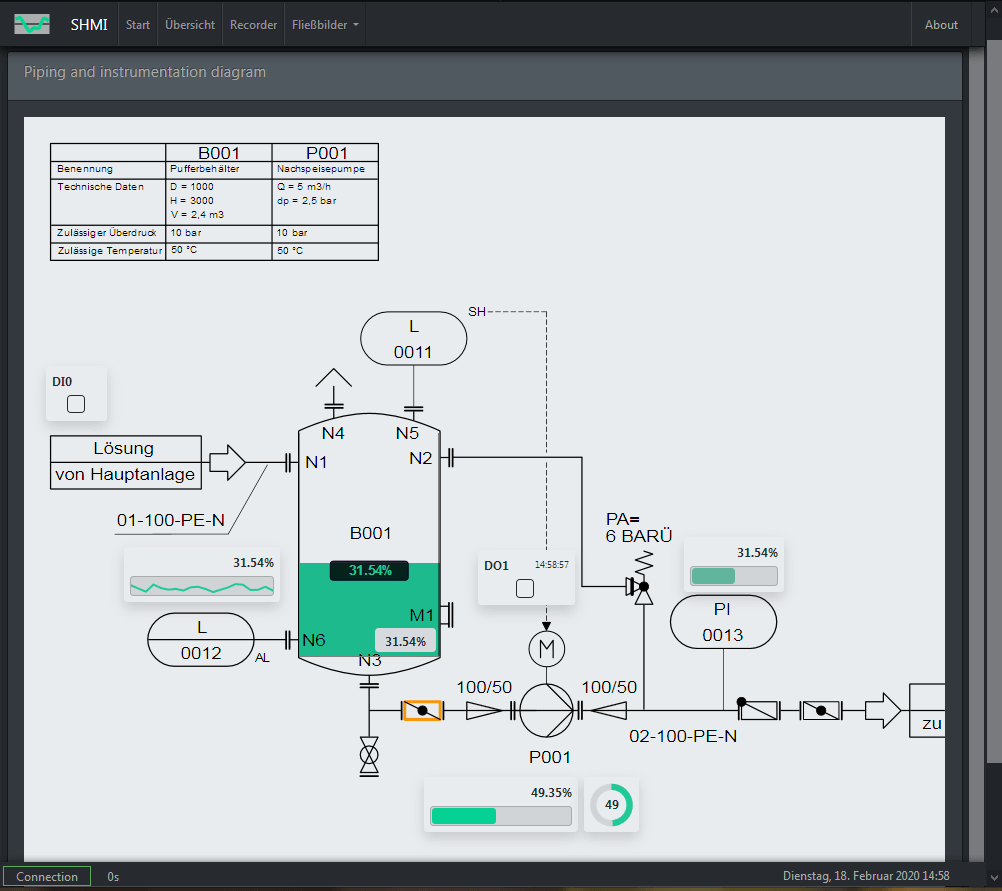
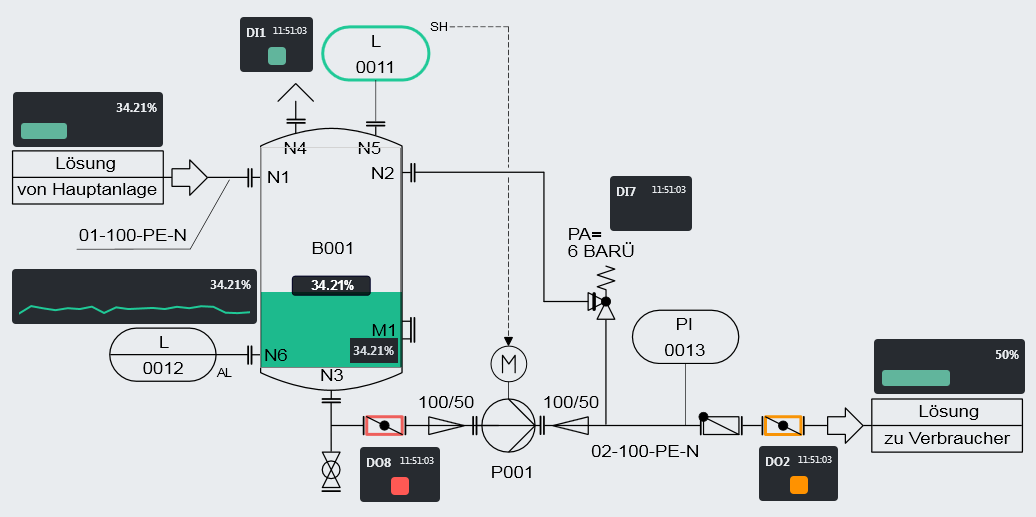
Flowchart
The image itself is loaded as background image. It must have the same name as the HTML file, but with the suffix “svg”. Alternatively a PNG image can be loaded.
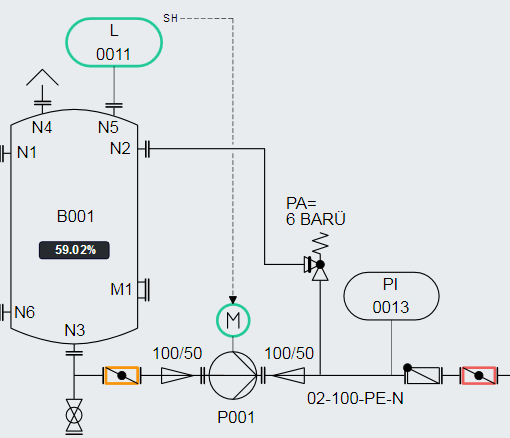
Only SVG images can be animated directly!
Priority when loading:
- SVG
- PNG (preferably transparent)
All available data points can be inserted into the image as small displays (widgets; design not yet finished). Currently available:
To do this, select the corresponding data points in the settings, with the corresponding display type. This inserts the corresponding display at the top right of the screen. Then you can drag it to the appropriate place in the image and change its width if necessary.
For an easier positioning, a “Snap to Grid” option is built in. This is set to 10px by default.
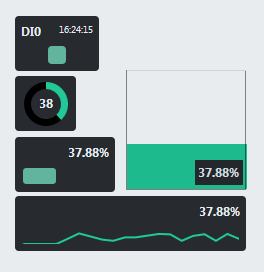
The following display options (mini-panels) are currently available
- Digital:
- On / Off ( LED ) incl. timestamp
- Analog:
- meters
- Sparkline (curve)
- Gauge
- Level with value display (vertical e.g.: as filling level for tanks, freely scalable)
Save / load / delete the mini-panels
Save
It is not necessary to save the elements.
As soon as they are positioned or resized, the position and size of the ads are saved in the local storage of the browser. A corresponding entry is saved for each element.
Load
When the page is loaded, the elements are automatically displayed again.
Delete
To delete an element, deselect it in the settings.
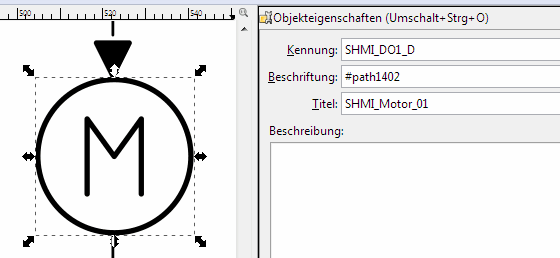
Direct animation in the image (SVG only):
Currently only DI/DO and Analog as value
Give the element a corresponding ID (for Inkscape: “Kennung”).
Scheme: SHMI_Dxx_D
Dxx = Digital data point
Output as color:
- 0 = black
- 1 = green
- 2 = orange (warning)
- 4 = red (alert)
Scheme: SHMI_Axx_A
Axx = Analog data point
Is output as text.
Operating result:
Design and colours are not yet fixed!
Labelling of the surface
The texts for labelling the surface are in the file:
lng/en.json
The interface is not yet fully translated.
{
"DI": "Digital inputs",
"DO": "Digital Outputs",
"AI": "Analogue inputs",
"AO": "Analog outputs",
"Prefs": "Settings"
}
Logo
Replace the file pict/logo.svg with your own SVG image.
Design of the interface
Replace the file css/bootstrap.min.css with the corresponding theme file.
For a different design, rename the file css/_SGMI_glow.css to css/SGMI_glow.css
Icons
…
Discussion / suggestions
ToDo
Order does not correspond to priority:
General
- Update to Bootstrap 5.3
- Update to jQuery 3.6.3
- Replacing Moment.js with Day.js
- Save settings locally
- Import/Export of settings
- counters and times as additional data points
- Changing the display language via the interface
- Output messages from the control system (alarm, warning and operating messages)
- Deactivation of animations for weaker display devices
- Logo: Fallback to PNG
- Save and retrieve fonts locally
- Revise documentation of the source code
- Documentation as Wiki
- Minimized version of all files
- Controlling values (only when the rest is stable)
- Cleaning up the source code - the whole thing was an experimental project from 2014 with lots of copy & paste and superfluous code …
- Split labels for data points and surface into single files
- Upload files completely
- Icon-Font Subsetting
- Remove unused CSS
- Summarize CSS
- Live bit from controller to interface (visualize)
- Online demo
- Change I/O colors to better display errors and warnings
- Update libraries
- Update to the current bootstrap version 4
Dashboard
- Variable number of pages
- Adjustable grouping of the values
- Hide unused cards / panels
Analog
- Scaling analog values
- Peak hold for analog display
- Setting for the hold time / peak hold
- Optimize analog display
- Setting the update interval (digital / analog separated)
Digital
- Time display for last change
- Setting the update interval (digital / analog separated)
Recorder
- Optimize surface
- Change from Flot-Chart to Chart.js
- Change time format to CSV (-> Timestamp)
- Prefilter for analog values (low pass)
- Trigger (High / Low / Band)
- Adjust timeline to timestamp from interface (current: browser time)
- possible measured value interpolation in case of missing or invalid measured values (optional)
- More statistics functions
- Adapting and optimizing the recorder to the current library versions
- Time compensation of the mean values
Curves (not yet available)
- D/A separated
- Calculations between the curves (difference, sum etc.)
- Trigger
Flow charts
- Make displays rotatable (90°)
- Additional data points for the animation (e.g. to display switched paths)
- more display options (only values, panel with all data)
- more display options (gauge)
- Display values in image
- Revise the design of the displays
- Animation (coloring) of SVG images
Used libraries
Author
Thorsten Willert
License
The whole thing is under the MIT license.
Other
-
P&I flow chart (RI_01.svg): From Con-struct - Own Plant, CC BY-SA 3.0
-
Bootstrap Theme: From Thomas Park / Bootswatch, MIT